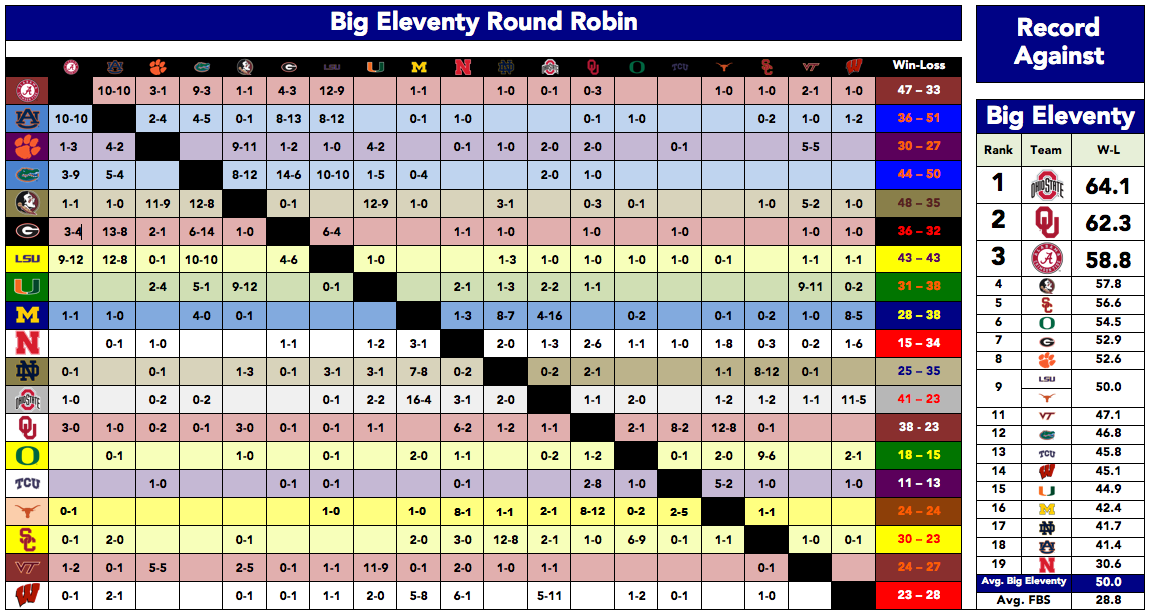
The Big Eleventy Conference is an exercise to isolate the most successful FBS programs over a 20-year period, and to extrapolate further comparisons among those teams. The Big Eleventy uses a completely made up number in its title, which seemed fitting.
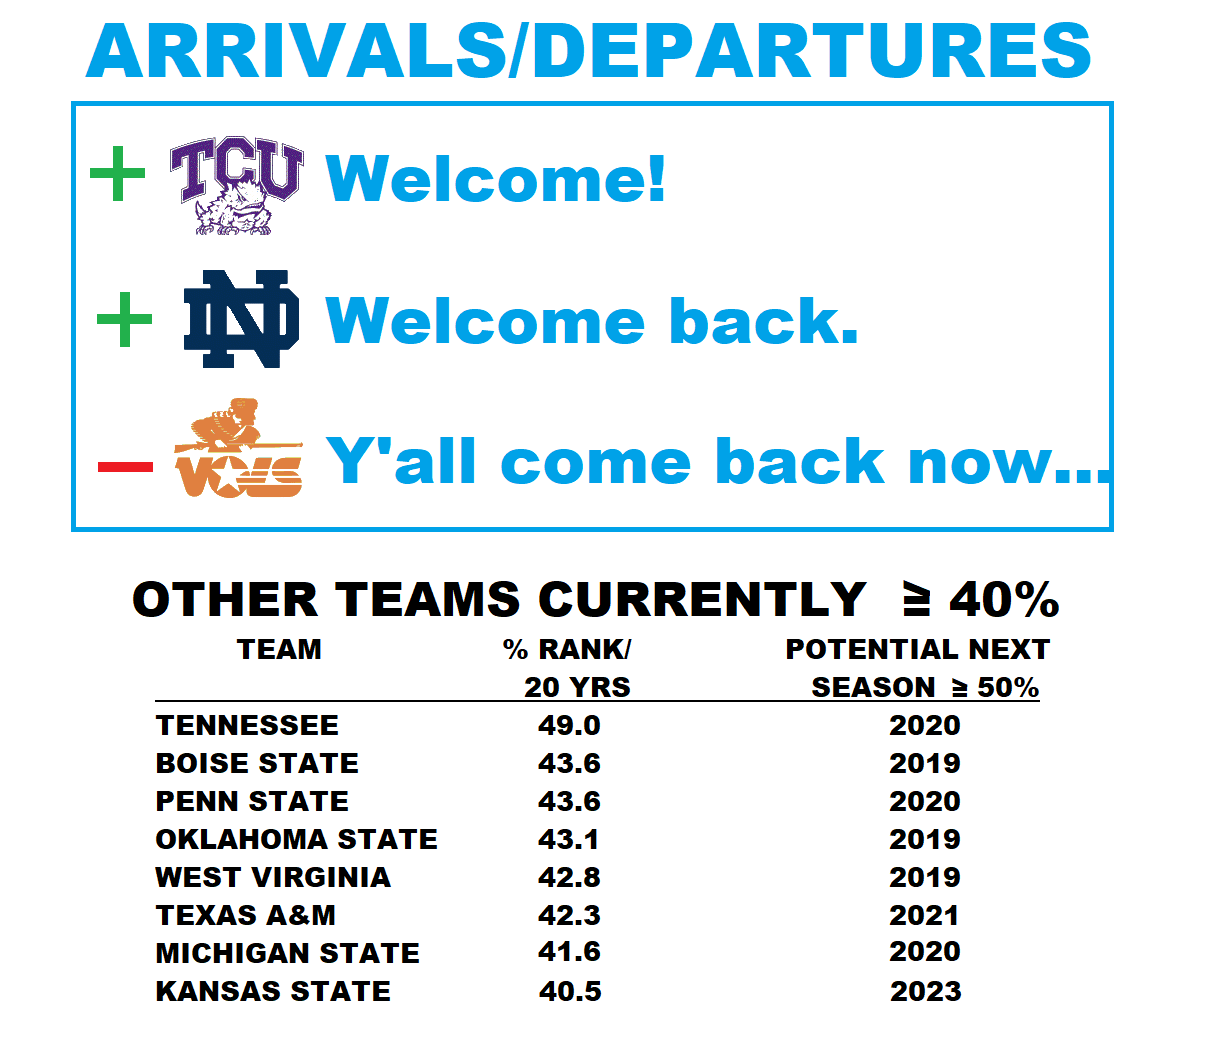
The admission threshold is simple: Teams ranked more than half of the past 20 seasons are in.
This time around, two new teams joined the conference and one dropped out. The following 19 teams made the cut: Alabama, Auburn, Clemson, Florida, Florida State, Georgia, LSU, Miami, Michigan, Nebraska, Notre Dame, Ohio State, Oklahoma, Oregon, TCU, Texas, USC, Virginia Tech, and Wisconsin.

Top Ten
Top ten comparisons are now included along with Top 25 (ranked), Top 5, and No. 1 ranking comparisons.


Metrics
This season I decided to give a crack at including metric comparisons for offense, defense, and overall team rankings. Currently, only the Simple Ranking System (SRS) goes back before 2003; from there Bill Connelly's S&P (Five Factors) and Brian Fremeau's Efficiency Index (FEI) are available.
Simply comparing average rankings across each metric might have sufficed for this project, but I wanted to be able to compare the actual scores across the different metrics as well.
Relating the scores seemed like a math problem I could handle. I went to work rescaling each metric model to get a 0-100 score and then averaged the yearly totals.
Every metric exhibits the same behavior across its scale. The top and bottom team ratings each year can be a little erratic. The closer to the middle of the rankings you get, the more stable the numbers get. What I tended to see every 25% of the rankings was a scale that ran on a basic 3, 1, 0, -1, -3 curve.
Since all of the metric values I used behave in this way regardless of the actual numeric scale, I derived equations to give them all a 0-100 value. I then averaged them out for the years available. (Once the S&P and FEI rankings were both active, I phased out the SRS numbers.)
Converting the scales in this manner does mean that in some seasons an exceptionally good offense, defense, or team might get a score >100 (or negative, although none of these teams run into that). Some seasons, nobody gets a 100 in a category, too.
If this is difficult to see in words, here is a visual display for metric "scores" rescaling to a 0-100 scale.

The mathematical formulas for the FEI value and Offensive SRS (OSRS) value are shown below in the Excel spreadsheet for those who work best with equations.
My experience with the Mcubed.net metric ranking
Most available metrics do not have data all the way back to 1997. So when I discovered another metric (Mcubed.net) that went back past 20 years, I was very excited.
I hadn't come across this metric before, so I was a little curious why it wasn't widely used. After a little exploring, I discovered mcubed.net is run by Michigan fans. (Edit: As historyhokie pointed out, it is not.) I actually ran a test to make sure the purpose of this metric wasn't an effort to make them look better than their rivals. It passed with flying colors, actually. Ohio State averages better rankings in this system than even Michigan does.
But I was pretty lucky to pick an arbitrary starting point of 1997. In that season, Michigan won their last national title, soured somewhat by the Coaches Poll crowning Nebraska its champion.
In 2002, the website mcubed.net was spawned, complete with a cherry picked metric that displayed that they were better than Nebraska that season. The only other metric with data for that season (the SRS) suggested that FSU was the No. 1 team, followed by Nebraska at No. 2, and eventually No. 5 Michigan.
Verdict: I choose to pass on the mcubed metric; it appears to be a cherry-picked data point for Michigan fans to use for their 1997 national title claim. Still, Danny Coale caught the damn ball.


Comments
Please join The Key Players Club to read or post comments.
Please join The Key Players Club to read or post comments.
Please join The Key Players Club to read or post comments.
Please join The Key Players Club to read or post comments.
Please join The Key Players Club to read or post comments.
Please join The Key Players Club to read or post comments.
Please join The Key Players Club to read or post comments.
Please join The Key Players Club to read or post comments.
Please join The Key Players Club to read or post comments.
Please join The Key Players Club to read or post comments.
Please join The Key Players Club to read or post comments.
Please join The Key Players Club to read or post comments.
Please join The Key Players Club to read or post comments.
Please join The Key Players Club to read or post comments.
Please join The Key Players Club to read or post comments.
Please join The Key Players Club to read or post comments.
Please join The Key Players Club to read or post comments.
Please join The Key Players Club to read or post comments.
Please join The Key Players Club to read or post comments.
Please join The Key Players Club to read or post comments.
Please join The Key Players Club to read or post comments.
Please join The Key Players Club to read or post comments.
Please join The Key Players Club to read or post comments.
Please join The Key Players Club to read or post comments.
Please join The Key Players Club to read or post comments.
Please join The Key Players Club to read or post comments.
Please join The Key Players Club to read or post comments.
Please join The Key Players Club to read or post comments.
Please join The Key Players Club to read or post comments.
Please join The Key Players Club to read or post comments.
Please join The Key Players Club to read or post comments.
Please join The Key Players Club to read or post comments.